

Home-Energy-Analysis for Carbon Footprint Reduction
Reduce your CO2 Emissions with Home Energy Use Assessment
PLEASE NOTE: YOUR READING ENJOYMENT WILL BE STRONGLY ENHANCED WHEN YOU READ THIS ARTICLE WITH YOUR LAPTOP, NOT A SMARTPHONE.
by Klaus Heinemann, Ph.D.
4/17/2022


Abstract
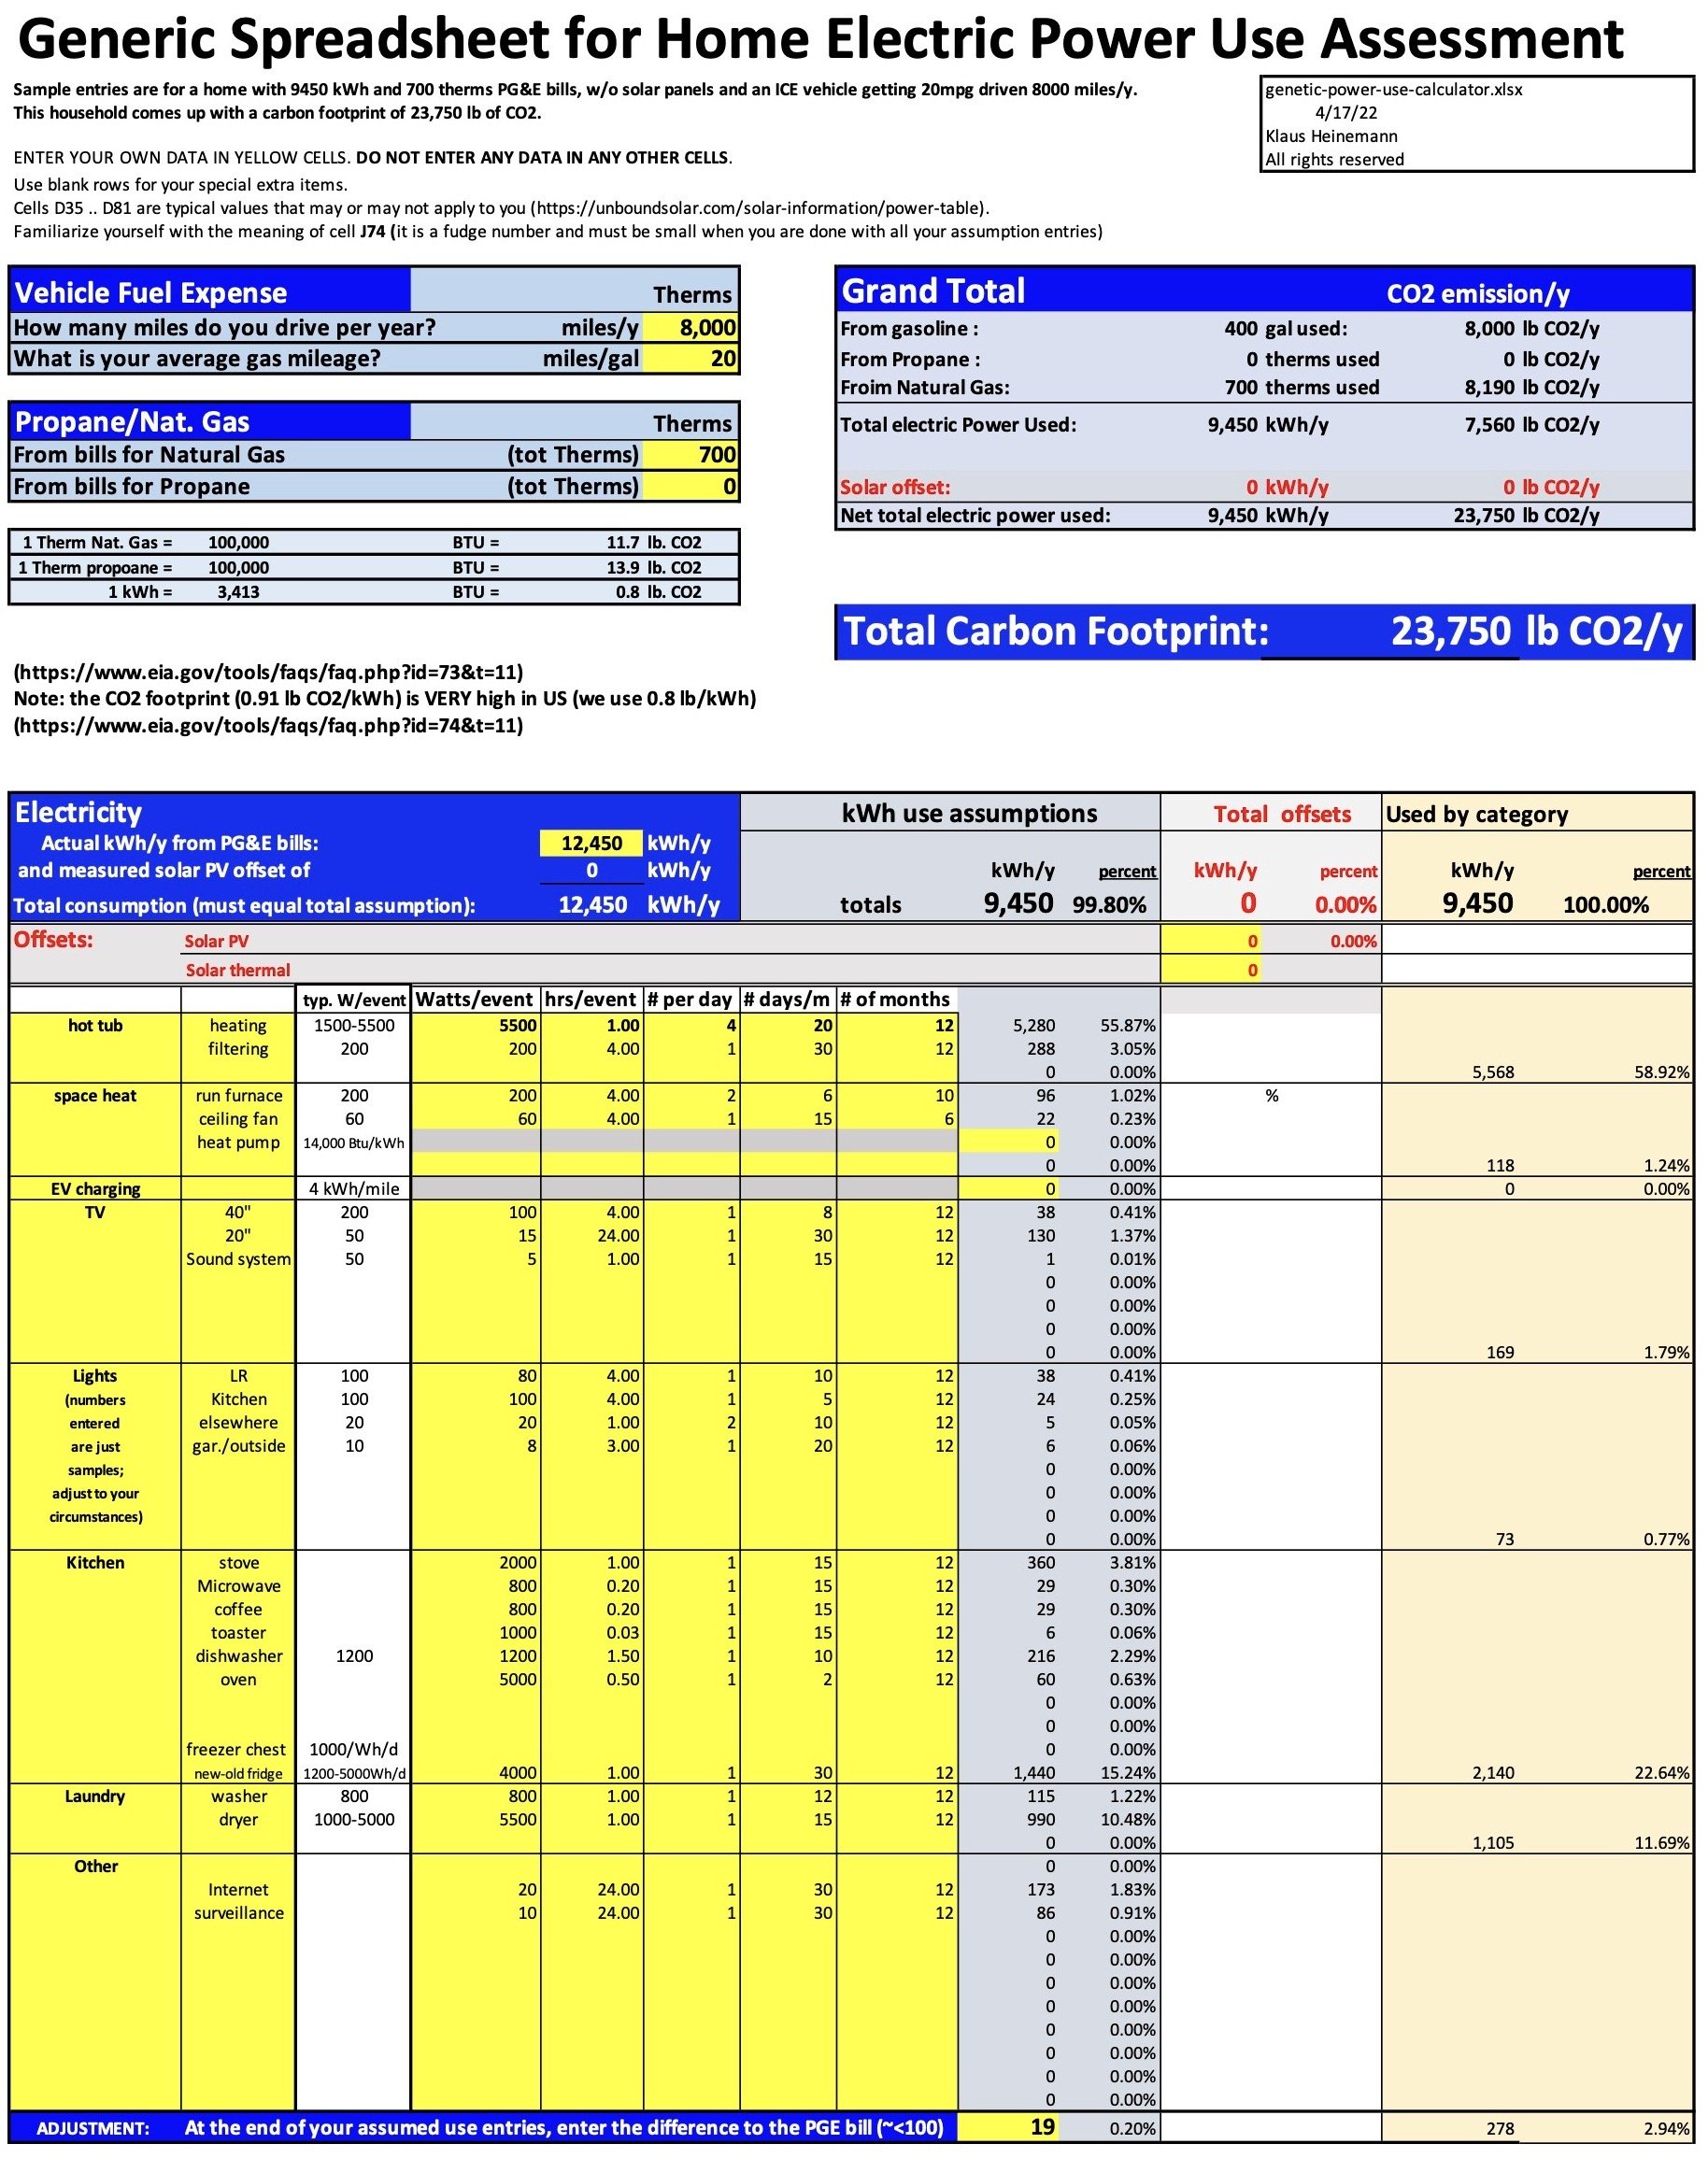
The above table is designed as a home energy analysis spreadsheet usable for any typical household. We have entered numbers for a typical home with an annual PG&E electricity bill for 9450 kWh used during a representative 12-month period. This particular home has no solar system and consumed additional 700 Therms of natural gas (for space heating, water heating, and cooking) during that period. Furthermore, this household drove only ICE vehicles, totaling 8000 miles in that year at 20 mpg average. The idea is for you to enter your own data and analyze them in your own privacy.
Principle
The overall idea is to come up with a reasonably best estimate how your actual electricity consumption, as evidenced on your PG&E bills, came about. Only then can you learn where you might best be able to reduce your consumption. To do this, go through your entire house and register separately each item that uses electricity. For each item. estimate how many Watts it consumes and how long and how often you use it, and enter this into this simple spreadsheet, replacing our sample numbers as obvious and fitting for your circumstances. (We invite you to request a blank, formatted Excel spreadsheet from us free of charge for you to use for this purpose; you would need access to “Excel” or “Numbers” or alike on your laptop, and you would need only rudimentary skill in using spreadsheets). The more specific you are with your entries, the more meaningful your results will be. Even if individual numbers are off, such errors tend to cancel each other out. For example, don’t just assume one number for lighting, but, instead, tend to each individual light bulb, or group of bulbs, in every room. Don’t just use a ballpark for the washing machine, but better try to assess how often you are actually using it.
After you have added up all kWh estimates for all items — the math for which, of course, will be done for you by the spreadsheet, compare the grand total kWh with the actual number of kWh you entered from your PG&E bill, and start “correcting/adjusting” your individual item estimates until they add up to be very close to the PG&E number. Of course, if you already have a solar PV system, as our sample house does not, you must logically add the number of kWh it produces per year back into your total consumption (enter it in cell L32, and the spreadsheet will do the rest for you), because your PG&E bills netted those out.
Results/Benefit
This is not a trivial undertaking, and it will take some time for you to complete. But you can do this in the comfort of your home office chair. You will be surprised about the result, i.e., how much or how little you used for each item or category of items, and how much you can save, both in pounds of CO2 saved, and in dollars saved, when you implement certain changes. Of course, for the monetary savings simply multiply the kilowatt-hours with the highest tier of your cost (because you will essentially always offset from your most expensive tier). In the PG&E territory, and specifically in Sunnyvale and Tbe Sea Ranch, we currently pay 34 cents per kWh in that tier, and we hear that this will soon increase to about 40 cents.
Running Scenarios
Once you have entered your specific numbers into your spreadsheet, you can easily examine how you fare when you change certain parameters, such as:
— What if you get an EV? Say, you drive your 8000 miles/year in an electric vehicle instead of your internal combustion engine (“ICE”) vehicle. For this, take the 8000 in cell G12 down to zero, which will reduce your carbon footprint from the original to 23,750 lb in our sample home to 15750 lb, but you must then add the 8000 miles driven in the EV as 2000 kWh charged, because you will be consuming about 1 kWh per 4 miles driven in your EV. Do this in cell J42, and you will see that your total CF now amounts to 17,350 lb/y, i.e., your greenhouse gas (GHG) emission is reduced by a whopping 6400 pounds of CO2.
— What if you throw out your gas furnace and replace it with a heat pump? Don’t forget to get back to your baseline by undoing your previous changes in the spreadsheet. Then set cell G16 to 100 (assuming that 600 of the 700 therms of your natural gas consumption were for space heating, while the other 100 therms were for water heating and cooking, which you retain for this exercise. Then enter the electric power spent to run the heat pump in cell J40. A state-of-the-art heat pump will run at an efficiency of 4, which means it will produce 600 therms of heat using 600*100.000/3413/4 = 4395 kWh to do the same job as your gas furnace did. Enter that number in cell J40 and find that your CF has decreased from 23,750 to 20,246 pounds of CO2, reduced by a non-trivial amount of about 3,500 pounds.
— What if you add a solar PV system? Say, you have space on your roof for a 4.92 kW solar PV system, facing south at your roof tilt angle of 18.4 degrees. From the calculations with the SOLARCALCS program (see https://www.healingguidance.net/sdolarcalcs) you find that it will produce 7808 kWh per year (in Sea Ranch weather). Entering this number — again after re-setting the previous changes to get back to the baseline — in cell L32. Note that your CF has now dropped by about 6250 lb to 17504 lb. Note that this solar system will offset 82.6% of your baseline electric power consumption, which is now reduced to 1642 kWh. These numbers are all realistic for typical households.
You can add the benefits of these three CF-saving measures and see that, if you implement them all, you reduce your carbon footprint by a whopping 17,000 lb of CO2. (You have still 6750 lb to go, but you started from a number that is far above the U.S. average, which is somewhere less than 10,000 lb/y, not counting vehicle miles). Simply getting rid of your hot tub, which we assumed you have, or getting a solar thermal collector for it, will get you close to zero. And replacing your “ancient” 1980s refrigerator with a new, “star-rated” one will easily cut another few hundred pounds in and by itself. You can now run these and many more scenarios ad libitum.
Note that all these savings we have just considered come at no loss of comfort to you. In fact, going by my own experience, you will likely more than welcome driving an EV. The change to a heat pump will add the possibility of using it also for air conditioning in the hot summer months, which you may not have been enjoying at all with your conventional heating system. And the solar PV system will remain entirely unnoticed, i.e., neutral to you — my PV systems have functioned entirely without any problems for many years.

A plug for Additional Societal Benefits of EVs
As of the end of 2021, there were about 1 million EVs in California. Each has a battery pack averaging about 70 kWh. This, in and by itself, is a huge “infrastructure-type” resource that could be made available to the benefit of the general public. The pricing for large scale electric storage equipment (batteries) is now around $200-400/kWh and is expected to level at about $100/kWh. So 1 million EVs contain about $7 billion worth of energy storage equipment. This could be creatively utilized in two ways:

(a) Back-up during PSPS periods: It can be shown that only about 6kWh will bridge a household comfortably over two, or even three, 24-hour periods of “Public Safety Power Shutoff,” if one prudently avoids power-intensive consumption during such periods. This means that, for all practical purposes, the battery of an EV can bridge over numerous days, most certainly over longer periods that any PSPS would typically last. All that would be needed is the installation of a transfer switch to the home circuit breaker panel, similar to what is conventionally used to connect a regular gasoline or propane operated generator, and a reverse operating inverter, taking the DC power from the EV and transforming it to 120V-AC. Tesla has no incentive — yet — to permit this, even though the technology is essentially already built into their cars. They want to sell their “Power-Walls,” which are expensive and profitable to them, in particular because they are often deliberately over-sized [to much more than 10 kWh] — and getting away with it.
Legislative action would be needed to require that all EVs permit reverse discharging of their batteries back into the grid.
(b) Power Company “on-peak/off-peak” consumption leveling: Power companies must make expensive investments in facilities that can store energy generated during low-peak hours, which they then have to deliver during on-peak hours. This allows them to avoid investment in even more expensive power generation facilities to meet demand during peak consumption periods. The biggest of these battery arrays that came on-line recently in the PG&E area can store about one million kWh. This compares to an aggregate of 60 million kWh stored in the batteries of the EVs registered in California in 2021 (!). And this number is increasing by about another 12 million kWh per year (=200,000 EVs with 60kWh of batteries) in the near future, valued at another $2 billion/year in comparable capital cost for electricity storage, all available to PG&E, in principle, at zero capital cost to them. It has been proposed to make use of this huge amount of potential free storage capacity within some sort of program that is beneficial for all concerned, whereby EVs, when not in use on the road, could be connected, at the home of their owners, to the public power grid grid and sell power during high peak hours and at peak pricing pricing back to the power company. This is similar to what is now customary for solar PV systems with integrated batteries. Existing power generating plants would then not have to be idle during off-peak hours, saving billions in avoided cost for building new generating plants or for huge storage battery systems.
Again, the technology is readily available, but the EV industry and owners would have to be incentivized to go along, and the power companies would have to come up with incentivizing pricing programs. Legislative action is already underway and needs public support.

Some Amazing numbers
— 1 acre of average wildfire causes ~50,000 lb of CO2 emissions as grand average in CA, which equals the carbon footprint of about 3-5 fuel conserving homes/year. (Consider this as large-scale average over hundreds of wildfires over a million acres in aggregate, including a thousand structures burned; an average grass fire emits much less CO2, and an average suburban firestorm like the 2017 fire in Santa Rosa or the 2018 fire in Paradise, CA, emits much more).
https://ww2.arb.ca.gov/sites/default/files/2021-07/Wildfire%20Emission%20Estimates%20for%202020%20_Final.pdf
— 1 commercial cross-country flight uses ~16,000 gal of jet fuel, or about 40 gal/passenger, which causes ~800 lb of CO2 emissions per passenger (which equals ~800 miles driven in an ICE vehicle at 20 mpg).
https://www.epa.gov/sites/default/files/2020-04/documents/ghg-emission-factors-hub.pdf

All information in this website is copyrighted.
2022-2023 Klaus Heinemann